Katja Albrecht · 18 October 2026
Mapping Grove Soil Shifts Through Amateur Naturalist Journals from the 1940s
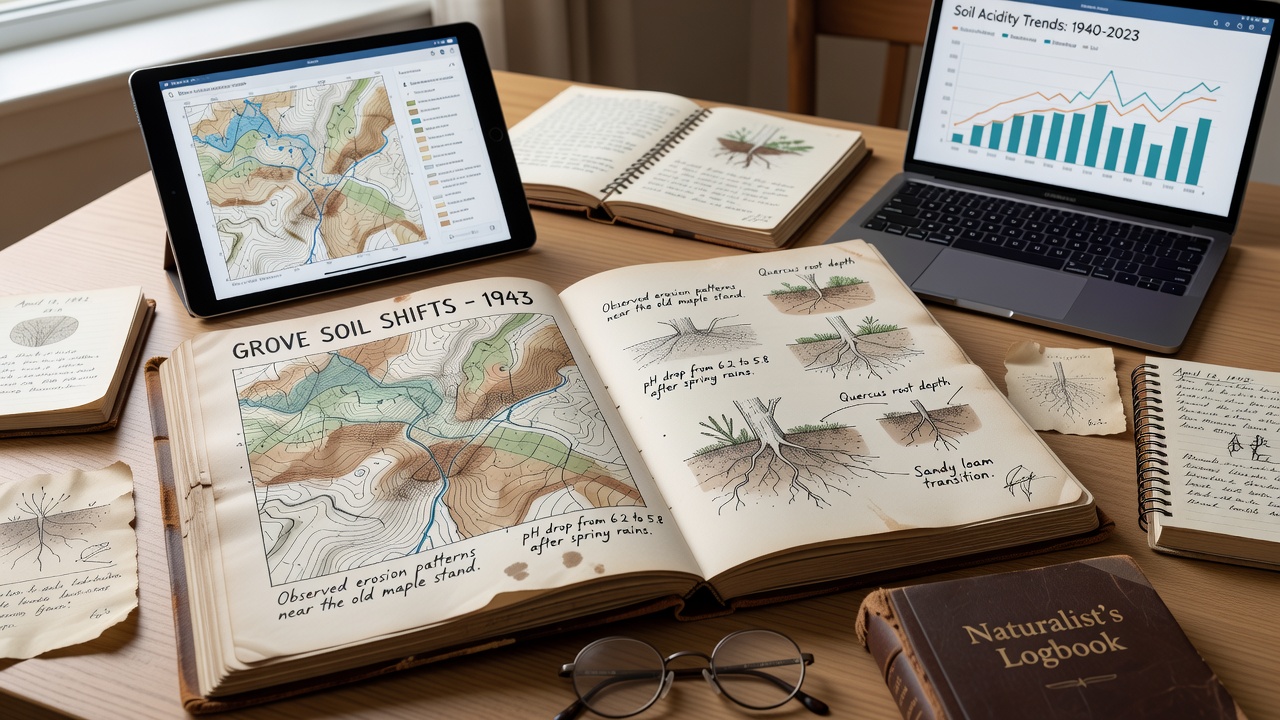
Amateur naturalist journals from the 1940s provide detailed records of soil conditions across the Grove area, and researchers now use these documents to track long-term shifts in composition, moisture retention, and erosion patterns. Entries often include handwritten notes on texture changes after seasonal rains, along with observations of vegetation cover that correlate with underlying soil stability. Those who catalog these materials note consistent references to specific locations where topsoil depth decreased over successive years, while other sections describe gradual increases in organic matter following periods of reduced disturbance.
Extracting Soil Data from Personal Accounts
Observers have compiled thousands of entries from local observers who maintained regular field notes during the decade, and these accounts frequently mention measurable differences in soil color and consistency between spring and fall visits to the same sites. One collection from a resident near the central groves lists pH estimates derived from simple litmus tests alongside descriptions of earthworm activity that served as indirect indicators of fertility levels. Such details allow mapping projects to reconstruct baseline conditions before widespread agricultural expansion altered drainage patterns in later decades.
Cross-referencing multiple journals reveals clusters of reports around particular soil types, and analysts plot these against modern surveys to identify areas where compaction or nutrient depletion has progressed most noticeably. Entries also record instances of flooding events that redistributed sediment, with dates and approximate volumes noted in margins that help calibrate models of historical runoff. Researchers apply geospatial tools to convert these qualitative descriptions into quantitative layers showing how certain fields transitioned from loamy to more clay-heavy profiles over the ten-year span.
Techniques for Reconstructing Historical Maps
Teams digitize journal pages and apply optical character recognition tuned for cursive script, after which they tag mentions of soil attributes with geographic coordinates drawn from accompanying sketches or landmarks. This process produces time-stamped layers that overlay onto current satellite imagery, highlighting zones where soil organic carbon appears to have declined steadily. Additional validation comes from comparing journal descriptions with archived weather data that confirms correlations between heavy precipitation years and accelerated erosion noted by multiple writers in the same vicinity.
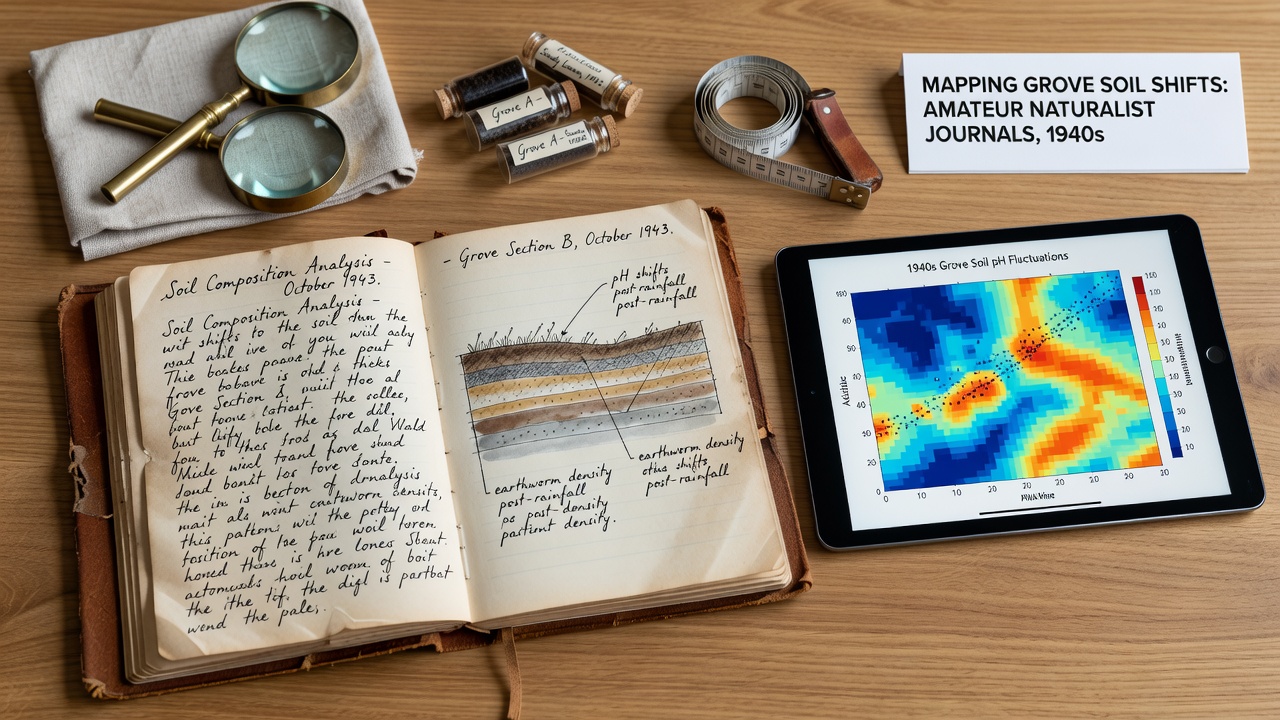
What's interesting is how repeated observations of root penetration depths in successive seasons allow inference of compaction trends, and analysts combine these with references to earth color shifts to estimate shifts in mineral content. Data from the United States Department of Agriculture Natural Resources Conservation Service supplies control points that anchor the historical interpretations to verified benchmarks. Observers note that journals from higher elevations tend to record faster drainage and lighter soils, whereas lowland entries emphasize seasonal waterlogging that influenced later land-use decisions.
Patterns Across the Grove Landscape
Analysis of the assembled records shows distinct clusters where soil shifts concentrated near former stream channels that were later straightened, and these areas exhibit the most pronounced changes in permeability according to the accumulated notes. Entries from 1943 through 1947 frequently describe increasing dustiness during dry spells, which aligns with documented reductions in ground cover that journals attribute to both drought cycles and grazing pressure. Researchers map these trends at a resolution fine enough to distinguish between adjacent parcels that experienced different management histories.
But here's the thing: some journals include sketches of soil profiles exposed by tree falls, and these drawings provide vertical context that horizontal surface notes lack, revealing layering changes over the period. In October 2026, updated mapping outputs incorporating newly transcribed volumes will be presented at regional environmental monitoring workshops, allowing further refinement of predictive models for future soil behavior under varying climate scenarios. Patterns identified so far indicate that areas with repeated mentions of organic amendments in the 1940s show slower rates of nutrient loss when compared against control sites lacking such records.
Integration with Contemporary Monitoring
Current projects combine the digitized 1940s data with sensor networks that track real-time moisture and compaction, creating continuous records that span more than eight decades. Reports from the European Soil Data Centre supply comparative frameworks from similar temperate regions that help contextualize the Grove findings within broader European datasets. The combined layers support land managers who seek to prioritize restoration efforts where historical trends point to accelerated degradation.
Entries describing changes in soil fauna populations, such as declines in certain beetle species tied to surface crusting, add biological dimensions to the physical maps. Analysts cross-check these against pollen records preserved in nearby sediment cores to confirm vegetation-soil linkages over the same timeframe. This multi-source approach strengthens confidence in the reconstructed shifts without relying on any single journal's perspective.
Conclusion
The 1940s amateur naturalist journals continue to serve as primary sources for mapping soil dynamics in the Grove region, and ongoing digitization efforts expand the dataset available for analysis. Integration with modern geospatial methods transforms scattered personal observations into coherent spatial histories that inform both scientific understanding and practical land management. As additional volumes receive transcription, the resolution of these historical maps will improve, offering clearer views of how soil conditions evolved through that pivotal decade and beyond.